Showing posts with label Announcements. Show all posts

Tuesday, September 18, 2012

Get social, mobile, and 40+ new data points with the Google Analytics API


Google Analytics Core Reporting APIs enable a powerful and flexible way to analyze, report on, and ultimately optimize such things as web and mobile experiences, conversions, and sales.


Today we’re adding over 40 new metrics and dimensions that can be queried through the Core Reporting API. This enables developers to create reports that are similar to what is available in the Google Analytics web interface for important areas such as social and mobile. See a full list of additions on the Core Reporting API changelog.


Here’s a rundown of what’s new and a few helpful questions the data can answer.


Social Data

Now you can get data for both on-site interactions with social buttons as well as off-site social data from social data hub partner networks.


Mobile Devices

For mobile visits to your site, get all the good stuff like like brand, model, and input type.


Geo

We added a new dimension to indicate the Designated Market Area (DMA) where traffic came from.


Page Path Rollups

Create your own drill down reports with these new dimensions that allow you to roll-up metrics to hierarchical levels of your property.


App & Exception Tracking

If you’re using the Google Analytics SDK for iOS/Android v2 beta, you can now retrieve App View and Exception metrics.


User Timings

New ways to report on all things related to user timing data.


Related Resources:


Wednesday, August 29, 2012

Get To Your Data Faster: Announcing Shortcuts In Google Analytics


We’re pleased to announce the addition of Shortcuts to Google Analytics. Shortcuts help you get to the exact view you want of your data in GA in record time. Rather than having to go through the "find report, add segment, change, sort" process daily, with Shortcuts you can do it once, save it, and come back to it in a single click.


How to create a Shortcut


Creating Shortcuts is simple. When viewing a standard or custom report in Google Analytics, click on the “Shortcut” button found on the report’s Utility Bar:


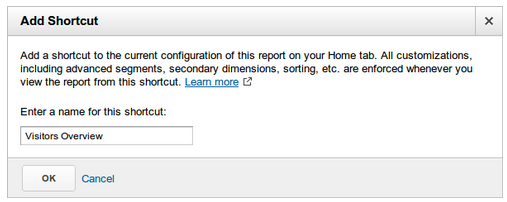
Then, give your new Shortcut a name:


Once named, you'll be taken straight to your report in the new "Shortcuts" section in the "Home" tab. Your report configuration has been stored, and your report shows up on the left side of the screen.


The following information is saved as part of a Shortcut:


  • Standard or custom report for context

  • Currently viewed tab on the report

  • Sort order

  • Advanced segments

  • Graphed metric


Notably not saved is the date range and sample size. This is because they are very dependent on the data you are looking at.


Using Shortcuts


In the "Home" tab in Google Analytics, there is a new section called "Shortcuts". Here, you can find all of the shortcuts you’ve created, and navigate to each one. Clicking a Shortcut will "reset" the segments that are applied - so you know you'll always see the same customization every time you use a Shortcut.


If you make any changes while viewing a Shortcut and you want to have those changes persist for the next time you view the Shortcut, just click on “Save” from the report’s Utility Bar:


Managing Shortcuts


You can easily manage your Shortcuts from the Overview page, found under the Shortcuts navigation on the “Home” tab. From this page, you can also delete any of your created Shortcuts:


What else should you know?


  • Shortcuts can be emailed and exported like any other standard report.


    • Deleting a Shortcut will remove that report from any scheduled emails, as with deleting a custom report.


  • Shortcuts apply at the profile level, like the rest of reports in Google Analytics.


This is a continued step in making your experience with Google Analytics as efficient as possible. We hope you find Shortcuts a useful feature.  


Posted by Andrew Seguin, Google Analytics Team


Monday, August 27, 2012

Some Changes to DoubleClick Ad Planner


We are constantly evaluating our products to make sure that we are investing in tools that create the most value for our customers. Sometimes this requires making some changes...as we will be with DoubleClick Ad Planner. Starting on September 5, 2012, DoubleClick Ad Planner will become a tool dedicated to researching placements across the 2 million sites comprising the Google Display Network. Our goal will be to make this a best-in-class planning product for the GDN. It will also get a new name: the Google Display Network Ad Planner.

In order to maintain the highest level of quality planning data and to invest in new functionality, we will also need to discontinue some existing features. You will start to see, for example, that certain filters and demographic data will no longer be available in Ad Planner.

Next Steps


  • Please visit our Ad Planner Help Center for a full list of changes.

  • If there is any data or media plans that you will need after this change that will no longer be available, please export and save them before September 5th.


Thanks for your support and understanding as we continue to focus on developing new monetization features for publishers and advertisers.

Posted by Vincent Lacey, Product Manager

Thursday, August 23, 2012

Automate Google Analytics Reporting using Google Apps Script

Many people have been asking for a simple way to put Google Analytics data into a Google Spreadsheet. Once the data is inside a Google Spreadsheet, users can easily manipulate Google Analytics data, create new visualizations, and build internal dashboards.


So today we released a new integration that dramatically reduces the work required to put Google Analytics data into any Apps Script supported product, such as Google Docs, Sites, or Spreadsheets.


Here’s an example of Google Analytics data accessed through Apps Script and displayed in a Google Spreadsheet.


Custom API Dashboards - No Code Required


We know that a popular use case of this integration will be to create dashboards that automatically update. To make this easy to do, we’ve added a script to the Spreadsheets script gallery that handles all this work - no code required. The script is called Google Analytics Report Automation (Magic).


This script is a great template for starting your own project, and we’ve had many internal Google teams save hours of time using this tool. Here’s a video demoing how to build a dashboard using this script:


You can find this script by opening or creating a Google Spreadsheet, clicking Tools -> Script Gallery and searching for “analytics magic”.


Writing Your Own Script


Of course many developers will want to write their own code. With the new Analytics – Apps Script integration, you can request the total visitors, visits, and pageviews over time and put this data into a spreadsheet with just the following code:

// Get Data.
var results = Analytics.Data.Ga.get(
tableId,
startDate,
endDate,
'ga:visitors,ga:visits,ga:pageviews',
{‘dimensions’: ‘ga:date’});

// Output to spreadsheet.
var sheet = SpreadsheetApp.getActiveSpreadsheet().insertSheet();
sheet.getRange(2, 1, results.getRows().length, headerNames.length)
.setValues(results.getRows());

// Make Sandwich.

To get started now, read our Automated Access to Google Analytics Data in Google Spreadsheets tutorial. Also check out the Google Analytics Apps Script reference docs.


Solving Business Problems


Are you ready to start building solutions using Google Analytics and Google Apps Script?


We’d love to hear new ways you use this integration to help manipulate, visualize and present data to solve business problems. To encourage you to try out this integration, we are giving out Google Analytics developer t-shirts to the first 15 developers to build a solution using both APIs.


To be eligible, you must publish your solution to either the Chrome Web Store or the Spreadsheets Script Gallery and include a description of a business problem the script solves. We’ll then collect these scripts and highlight the solutions in an upcoming blog post. After you publish your script, fill out this form to share what you’ve built.


We’re looking forward to seeing what you can do with this integration.


Posted by Nick Mihailovski   profile


Nick is a Senior Developer Programs Engineer working on the Google Analytics API. In his spare time he likes to travel around the world.


Tuesday, July 31, 2012

Introducing the Multi-Channel Funnels Reporting API

Measuring how marketing efforts influence conversions can be difficult, especially when your customers interact with multiple marketing channels over time before converting. Last fall, we launched Multi-Channel Funnels in Google Analytics, a new set of reports that help shed light on the full path users follow to conversion, rather than just the last click. One request we’ve had since the beginning was to make this data available via an API to allow developers to extend and automate use cases with the data. So today we’re releasing the new Google Analytics Multi-Channel Funnels Reporting API.


The API allows you to query for metrics like Assisted Conversions, First Interactions Conversions, and Last Interaction conversions, as well as Top Paths, Path Length and Time Lag, to incorporate conversion path data into your applications. Key use cases we’ve seen so far involve combining this conversion path data with other data sources, such as cost data, creating new visualizations, as well as using this data to automate processes such as bidding.


For example, Cardinal Path used the new Multi-Channel Funnels API, Analytics Canvas ETL (Extract, Transform, Load) and Tableau Software to help their client, C3 Presents, uncover how time and channels affected Lollapalooza ticket sales in an analysis dubbed “MCF DNA.” The outcome was a new visualization, similar to a DNA graph, that helped shed light on how channels appeared throughout the conversion funnel.


MCF DNA Visualization in Tableu Software


In another case, Mazeberry, an analytics company from France, helped their client 123Fleurs decrease customer acquisition costs by 20% by integrating data from the Multi-Channel Funnels API into a new reporting framework. Their application, Mazeberry Express, combines media cost and full conversion path data to provide new Cost Per Acquisition (CPA) and Return on Investment (ROI) metrics that provide a more complete understanding of how online channels are working together to influence conversions.


Mazeberry Express Screenshot - Focus on a Channel


Please note that this functionality only works with the new v3.0 API libraries, so you should upgrade now if you haven’t already (see our migration guide). We look forward to seeing how you make use of this new data source.


Friday, July 27, 2012

A simpler way to re-connect with your website visitors

Google Analytics has always provided powerful tools to help you better understand your website visitors and improve their experience. Some of you have also started using insights from your website to optimize your remarketing campaigns and re-engage customers who have visited your site. But this has traditionally required you to add a second tag to your site for remarketing, in addition to your existing Google Analytics tag. To simplify the process, we’re rolling out Remarketing with Google Analytics in beta, to help you make the most of those valuable insights.


Remarketing with Google Analytics helps you create remarketing lists based on certain audiences who visit your website and show interest in your products, without having to tag your site twice. This can help you more easily create remarketing campaigns to show ads across the Google Display Network (GDN). 


We’ll be rolling this beta feature out in waves by the end of the summer to all Google Analytics users who are account administrators with at least one linked Google AdWords account. Once the feature is available to you, you can learn about the steps to enable it in your account by clicking on the "Admin" tab in the upper right corner of Google Analytics, then look for the tab for "Remarketing Lists.”


Remarketing can help improve the relevancy of the ads that users see online. We’re also committed to giving users increased control over the ads they see on Google and across the web with tools like Mute This Ad, the Ads Preferences Manager, and the Google Analytics Opt-out.


To learn more about Google’s suite of remarketing tools, please visit the AdWords blog here.


Happy analyzing... and happy remarketing!


Posted by Jesse Savage, Product Manager


Monday, July 23, 2012

Making Google Analytics Content Experiments Even Better

A few weeks ago, we announced Google Analytics Content Experiments.  Since our announcement, we have been busy making Content Experiments available to Google Analytics users and improving it based on your feedback.  We'd like to tell you about a few changes that we have recently introduced:


Content Experiments available to everyone. Every Google Analytics user can now access Content Experiments. You can find this feature under "Experiments" in the "Content" section of your Standard Reports.


Support for relative URLs. Using relative URLs affords you increased flexibility when defining the location of variations.  This is particularly useful if you have experiments running on multiple domains, subdomains, or pages. You can learn more about using relative URLs in Content Experiments by reading our Help Center article.


Ability to copy experiments. You can now copy experiments by clicking the Copy experiment button on the Edit Settings screen of the experiment you want to copy. If you are running an experiment on a page, this allows you to run additional experiments after the original one finishes without having to add experiment code to your page or otherwise modify it.


Improvements to the experiments report
. We've added regular Analytics-report capabilities to the experiment report, such as: Site Usage, Goal Set, and Ecommerce tabs, and the option to choose which variations you want to plot in the graph.


Click the above image to view the full report


We hope that you find these improvements useful. Our team is working hard to make Content Experiments in Google Analytics even better. Stay tuned for more news!


Posted by Inna Weiner, Software Engineer


Tuesday, July 17, 2012

Moving Google Analytics Forward - Retiring The Old Version

After a year of supporting both the old and new versions of Analytics, we are now fully transitioning and leaving the old version behind. This means that as of tomorrow we’ll be removing the link to the previous version which sits at the bottom of Google Analytics pages and all your analysis will take place in the new version.


It’s been a long journey to this point, and we hope you’ll find value in all of the features that the new version of Google Analytics offers. And our help center is a great resource to be sure you’re getting the most out of these new features and reports. The new version has been completely rebuilt on a more powerful platform that lets us move faster and develop more amazing features including these recent launches:


  • Real-Time shows you what’s happening on your site as it happens. Immediately see the impact that online campaigns, TV ads, or mentions at a live event can have on engagement with your website.


  • Multi-Channel Funnels provides insight on the full path to conversion over a 30 day period. The variety of marketing channels used to find your website, and not simply the last click, so you can make better decisions on your marketing investments.


  • Social Reports help you measure the impact of your social marketing initiatives and evaluate the effect social media has on the metrics which matter to your business.


  • Mobile Reports show how visitors from mobile devices and AdWords mobile campaigns engage with your website. See how many pages they visit, how much time they spend, as well as conversion and ecommerce insights to help you optimize your mobile strategies.


  • Content Experiments enables you to show different versions of a page to different visitors, then using a new advanced statistical engine measures the results of each to determine which is the most effective version.


We have received some really great feedback over the last year on what’s working and what’s not; we’ve been listening very closely and doing our best to incorporate the feedback and ideas.  We are continually working to improve upon Google Analytics and help provide you with tools to make better decisions for your website and marketing programs, so please keep providing the feedback.  You are our most important source of ideas for innovation!


Posted by Paul Muret, Director of Engineering, Google Analytics


Friday, June 29, 2012

Data At Your Fingertips: Announcing The Google Analytics App For Android

We are pleased to announce the launch of Google Analytics App for Android phones!


With the Google Analytics App, you can access the same accounts and profiles you see when you open Analytics from a desktop browser, but you’ll see reports that are optimized for your phone. 


Swipe through these reports to see the essential data about your websites and apps anywhere, anytime:


  • Real-Time: See the number of visitors you currently have and a list of the pages (for websites) or screens (for apps) that are currently popular.

  • Dashboard: Monitor the KPIs and user metrics you care about the most. By default, you’ll see your Daily Unique Visitors and your Goal Conversion Rate, but you can customize the dashboard to change which reports, metrics, or segments you see.  

  • Automatic and Customized Alerts: Google Analytics detects statistical anomalies in your data and can send you an alert when something unusual happens. See either automatic alerts, or customize your settings to send alerts based on your own benchmarks. 


Screenshot: The Realtime Report


Screenshot: The Dashboard


Visit Google Play to download and install the app to keep up with your data anytime, anywhere.


Peng Li, on behalf of the GA Mobile App team