Showing posts with label Features. Show all posts

Wednesday, August 29, 2012

Get To Your Data Faster: Announcing Shortcuts In Google Analytics


We’re pleased to announce the addition of Shortcuts to Google Analytics. Shortcuts help you get to the exact view you want of your data in GA in record time. Rather than having to go through the "find report, add segment, change, sort" process daily, with Shortcuts you can do it once, save it, and come back to it in a single click.


How to create a Shortcut


Creating Shortcuts is simple. When viewing a standard or custom report in Google Analytics, click on the “Shortcut” button found on the report’s Utility Bar:


Then, give your new Shortcut a name:


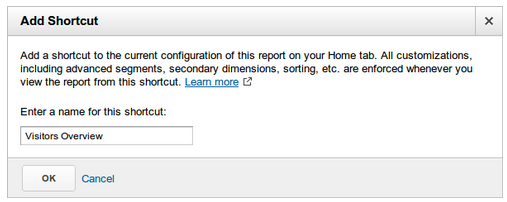
Once named, you'll be taken straight to your report in the new "Shortcuts" section in the "Home" tab. Your report configuration has been stored, and your report shows up on the left side of the screen.


The following information is saved as part of a Shortcut:


  • Standard or custom report for context

  • Currently viewed tab on the report
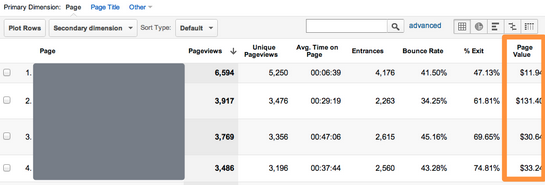
  • Sort order

  • Advanced segments

  • Graphed metric


Notably not saved is the date range and sample size. This is because they are very dependent on the data you are looking at.


Using Shortcuts


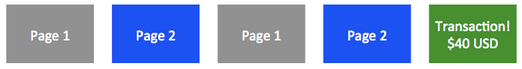
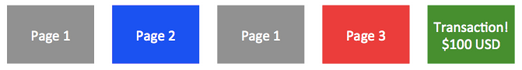
In the "Home" tab in Google Analytics, there is a new section called "Shortcuts". Here, you can find all of the shortcuts you’ve created, and navigate to each one. Clicking a Shortcut will "reset" the segments that are applied - so you know you'll always see the same customization every time you use a Shortcut.


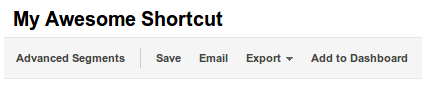
If you make any changes while viewing a Shortcut and you want to have those changes persist for the next time you view the Shortcut, just click on “Save” from the report’s Utility Bar:


Managing Shortcuts


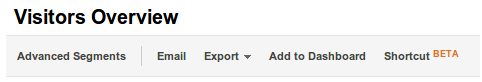
You can easily manage your Shortcuts from the Overview page, found under the Shortcuts navigation on the “Home” tab. From this page, you can also delete any of your created Shortcuts:


What else should you know?


  • Shortcuts can be emailed and exported like any other standard report.


    • Deleting a Shortcut will remove that report from any scheduled emails, as with deleting a custom report.


  • Shortcuts apply at the profile level, like the rest of reports in Google Analytics.


This is a continued step in making your experience with Google Analytics as efficient as possible. We hope you find Shortcuts a useful feature.  


Posted by Andrew Seguin, Google Analytics Team


Wednesday, August 8, 2012

Recommending the most relevant advertisers, publishers, and links

Over the past year, we've heard from publishers and advertisers that they want a network that can help them create meaningful relationships. We've listened, and today, we've released a completely new recommendation engine that redefines how you can find and take advantage of affiliate marketing opportunities.


Publishers can find advertiser recommendations under the Advertisers > Recommended advertisers sub-tab. This is where they can find a list of available programs ranked based on relevancy and predicted performance. Each recommendation also shows why the recommendation was made, along with an estimate of earnings potential for that advertiser. We display advertiser recommendations based on the criteria below:


  • Similar category: Advertisers are ranked by relevancy to your publisher category.

  • Revenue potential: Advertisers are ranked primarily based on estimated payout fees.


In addition to the average advertiser EPC, each recommendation has an estimated advertiser EPC. Estimated EPC is a brand new metric designed to help publishers understand how much they could potentially earn with that advertiser.


Advertisers can now see publisher recommendations, too. Using the recommendation engine, the Publishers > Recommended publishers sub-tab shows a list of publishers that Google algorithms recommend as a good fit based on similar categories and revenue potential.


We've also brought the power of recommendations to the Links tab to help publishers find and promote the most relevant ads with the highest performance potential. Under the Links > Recommended links sub-tab, we display recommended text and banner links that Google algorithms predict may perform best for each individual publisher.


For more details, we suggest reviewing these Help Center articles:


Sign in to your account and try out recommendations. After you’ve taken a few minutes to review, we’d love to hear from you in our forum.


Posted by:

Ali Pasha, Product Manager

Robin Anil, Software Engineer

Tuesday, July 24, 2012

Understanding And Using Page Value

When Google launched Google Analytics many moons ago (2005 to be exact) there was a metric named $Index. It wasn’t your standard analytics metric, like pageviews or visits. It was a calculated metric to help businesses understand value of content. Unfortunately $Index was removed from Google Analytics version 5 due to some technical limitations.


But now it’s back as a new metric named Page Value!


How Page Value Is Calculated


Page Value is calculated using the value of your transactions and your goals. So even if you don’t have an ecommerce website you can still use Page Value. Just make sure you have defined some goals and assigned them a value. (If you need more information about defining and tracking conversions check out our Getting Started Fast with Google Analytics webinar).


Here’s the exact formula of how Page Value is calculated:


Page Value = (Transaction Revenue + Total Goal Value) / Unique Pageviews for the page


Page Value can also be calculated for a group of pages, like a directory. In that case the definition changes slightly.


Page Value = (Transaction Revenue + Total Goal Value) / Total unique Pageviews for the group of pages


Remember, a unique pageview is just a count of visits that include the page. If a page is viewed five times in a single visit, Google Analytics will count five pageviews but one unique pageview.


Now there are a couple of things to be aware of. The calculation does not include all transaction and goal revenue for the entire visit. It’s only the goal conversions and transactions that happen after the page is viewed, not before the page is viewed.


Enough of the math and description, let’s look at an example. 


Here are two hypothetical visits:


Visit #1 activity:


Visit #2 activity:


Here’s how Google Analytics would calculate the value of Page 1, Page 2 and Page 3.


Page 1: ($100 revenue + $40 revenue + $0 goal value) / 2 unique pageviews = $70


Page 2: ($100 revenue + $40 revenue + $0 goal value) / 2 unique pageviews = $70


Page 3: ($100 transaction revenue + $0 goal value) / 1 unique pageviews = $100


How to Use Page Value


Page value is a measure of influence. It’s a single number that can help you better understand which pages on your site drive conversions and revenue. Pages with a high Page Value are more influential than pages with a low Page Value.


Get started by reviewing the Page Value column in the Content > All Pages report.


Your site probably has a lot of pages. Here’s a tip, use the Advanced Table Filter in the content report to remove some of the noise from this data. You can set up a filter to exclude pages with a Page Value of 0 or less than 30 pageviews. 


If you’re an ecommerce company you’ll immediately notice that the most valuable pages on your site are your checkout pages. This makes sense because everyone needs to view the checkout pages before converting.


Start by looking for pages that get a lot of traffic (pageviews) but have a low Page Value. Why don’t these pages help conversion? Should they? Use some of the other metrics, like Avg. Time on Page, Bounce Rate  or Exit Rate to get a better picture of the user experience on this page. 


If people are using the page, but not ultimately converting you may want to use some of the other content tools, like Flow Visualization, to get a better understanding of their experience after using a piece of content. 


Also look for pages that get a low volume of traffic but have a high Page Value. These pages are influential but don’t get a lot of attention. You might consider promoting them more via an external marketing campaign (email, PPC, social media) or an internal campaign (homepage banner, etc.).


If you work in SEO then you should definitely check out the Page Value for the content you are optimizing.


Page Value is not a silver bullet. It does not magically generate more conversions for your business. But it is an actionable metric that can help you understand the behavior of your visitors.


Posted by Google Analytics Advocate Justin Cutroni


Friday, June 29, 2012

Measuring a Mobile World: Introducing Mobile App Analytics

Mobile is changing the way that people communicate, work and play, and much of the growing adoption and innovation we're seeing in the industry is driven by mobile apps. There are already more than 600,000 mobile apps on Google Play alone, and we expect to see continued momentum throughout the industry. Mobile is also becoming front and center for marketers and businesses. As more of them understand the value of mobile apps, sophisticated measurement tools are becoming core to how marketers and app developers invest, analyze and market their apps. 


That’s why today we’re announcing a new set of reports in beta called Mobile App Analytics that help marketers and developers better measure their mobile apps. The reports are tailored for mobile app developers and marketers, speaking the language that matters to them. They are designed to measure the entire mobile customer journey - from discovery to download to engagement. This enables the creation of app experiences that are more useful and engaging through data-driven decisions at each stage of the app lifecycle:


  1. Acquisition and user metrics such as downloads and new users

  2. Engagement metrics such as retention, crashes and conversions

  3. Outcome metrics such as app sales and in-app purchases


Layout of new Mobile App Analytics reports


Here’s an outline of the new Mobile App Analytics along with screen grabs of selected reports:


Acquisition and User Analysis Reports - discover your best sources of new users


New and active users - measure the number of new and active users who launch your app everyday and analyze your most valuable segments. 


Google Play traffic sources - understand which traffic sources are driving new users and in-app conversions through Google Play to fine-tune your marketing initiatives. 


App versions - keep track of the distribution of active users over the older and newer versions of your app so you know what to support.


Device overview - check out the top mobile devices and OS versions that your app runs on, and optimize the experience for each device.


Engagement Reports - see how users interact with your app


User behavior - assess how loyal your users are, how frequently they use the app, and the engagement level of each loyalty group.


Engagement flow - visually see the screens, actions and paths users take to move throughout your application in order to optimize usage.


App crashes - see trends in crashes and exceptions that will help you troubleshoot problems on certain devices and operating systems.


Outcome / Business Impact Reports - identify whether users are accomplishing your goals


Goal conversions - set up conversion events in your app, like spending 10 minutes in the app, or clicking on ads to gauge success.


In-App purchases - if you sell virtual or tangible goods in your app, you can measure the number of purchases and the revenue generated.


The new reports are part of a holistic experience tailored for mobile app measurement, including a new and lightweight SDK v2.0 that’s easier to implement and is opt-out ready, with a streamlined back-end infrastructure.


We’ve also revamped our sign-up process, so new users can choose whether they want to start measuring their website or their mobile app. This means you’ll be just 3 clicks away from setting up your app analytics account and downloading the SDK.


We will be opening the beta up to whitelisted users in waves, so if you’re interested in using Mobile App Analytics for your app, please complete this beta signup form and we’ll get you started soon. We anticipate the reports will be available to all Google Analytics users by the end of the summer.


Also, if you are at Google I/O be sure to attend the Google Analytics session “Measuring the End-to-End Value of Your App” (from 11:30AM - 12:30PM today, June 29) where our lead engineers will tell you more about Mobile App Analytics and some other exciting things we’re working on.


Posted By JiaJing Wang, Product Manager, Google Analytics Team


Tuesday, June 26, 2012

Workflows Simplified - Introducing Flow Viz PDF Export and Alerts Widget

GA users have voiced their feature requests around Flow Viz, and we’ve listened. The team is very happy to introduce a new feature for Flow Viz: PDF Export.


The PDF export will respect your interactions within the flow. If you highlighted a connection, or changed the dimension, the exporter will print those out as well in color.


This feature can be found in all Flow Viz reports, including the Visitors Flow, Goal Flow, and Events Flow. You can go to your favorite Flow Viz reports and check it out now.


Besides PDF export, we’ve also been working on another useful feature. 


Ever wished that you have easier access to your alerts? What about a quick glance at the trend of your alerts, to see if there are any anomalies? Look no further. The GA team has been hard at work to bring the new alerts widget to your GA dashboard.


This new widget gives you a view on the number of automatic and/or custom alerts that you had over the date range selected. If you click on the widget, it will lead you to the intelligence events report, simplifying your workflow. 


This widget will automatically be included in all your newly created dashboards if you select the “starter dashboard” option. In addition, if you have already created a customized dashboard and would like to add this new feature, you’ll be able to find the alert widget under the TIMELINE visualization. 


Under the “Add a metric” drop down menu, you’ll be able to choose “All Alerts,” “Automatic Alerts,” or “Custom Alerts.” To learn more about alerts, please check out our help contents page.


Thank you for giving us your continuous feedback, and we hope these new features will help simplify your analytics workflows. Please reach out to us with questions and comments, and we are always happy to take additional feature requests under consideration.


Posted by Jerry Hong, Google Analytics team


Thursday, February 23, 2012

Faster, better order management

Since migrating to the Google stack last September, we’ve been working to improve the Google Affiliate Network interface by both adding new features and enhancing some existing ones.


As a part of that effort, we’ve just pushed out a brand new release of the Orders tab for both advertisers and publishers.


First, we've made the Orders tab fast. Very fast. Whether you’re looking up 10 orders or 10,000 orders, you'll see query results load in about the same amount of time.


Advertiser-facing changes:


We want to make it easier for you to handle bulk operations. So, we enabled inline order editing right from the Orders tab. No need to click through to another page -- you can simply edit the order inline. Once an order is updated, publisher and network fees are updated, too.


Also, it’s now easier to cancel orders in bulk. When you search for multiple orders, just select the orders you want to cancel and cancel them all at once.

Publisher-facing changes:


The key publisher feature we’ve added is the ability to directly edit the Member ID field for an order inline. If you're a publisher whose workflow involves verifying or editing the Member ID field, this process will now be much easier.


Finally, based on your feedback, we now display locked orders (e.g. those that have been paid out) in the tab, rather than just open orders. Keep in mind though that those locked orders can't be edited.


As always, we look forward to your feedback. Please use our forum for feedback and comments. Thanks!