Wednesday, July 25, 2012

New way to submit feedback about the administrator control panel


Google Apps is changing the way in which we collect your feedback. To provide feedback about the administrator control panel, navigate to the page you'd like to improve and click the 'Send Feedback' link at the bottom.

If you are experiencing an issue or would like to reach out to someone directly, please contact support. Contact information is available under the Support tab.

Editions included:
Google Apps, Google Apps for Business, Government and Education

Languages supported:
All languages supported

For more information:
http://www.google.com/tools/feedback
http://www.google.com/tools/feedback/intl/en/learnmore.html


whatsnew.googleapps.com

Get these product update alerts by email


Subscribe to the RSS feed of these updates

Tracking Adjusted Bounce Rate In Google Analytics

Have you ever wondered how many visitors really pay attention to your website before exiting the page? Have you wondered how many of those “bounced” visitors will remember where they’ve been in future? How many of them are totally useless, how many are not?


There is a way to track this!


Bounce rate” in Google Analytics is one of the key metrics that helps to evaluate the quality of your traffic. “Bounce” happens when the visitor exited the website right from the landing page, without going to any other page. This is a great indication on how relevant the content was for the user and how engaged they were with your website.


While working perfect for most websites, there are categories of sites where this metric is not enough. 


Imagine you’re promoting a blog post that describes all the benefits of your company. The visitor might read the whole post and remember your company and products really well - they might even go to search for your product on one of the search engines straight away. However, since the visitor only looked at 1 page (exactly where the blog post is) they will be recorded as bounced visitor.


Another example if you have a description of the product right on the landing page, and your phone number on the same page. The visitor might study the description and call straight away - again, they will be recorded as a bounced visitor, as only 1 page was viewed. There are many more examples, and even traditional websites may benefit from the method described below as opposed to the standard bounce rate.


There is a solution to this - something that we call “Adjusted bounce rate”. You implement a small tweak to your Google Analytics code, which executes an event when a user has spent over a certain amount of time on the webpage. Depending on the website, the time can range from 10 seconds to few minutes - you should decide for yourself the amount of time you consider the user to be sufficiently engaged with your website or product.


Once the event is executed, the visitor is no longer counted as “bounce,” even though no additional pageview is recorded. This will mean your bounce rate will show users who have not spent a required “minimal time” on your website - the ones who have really bounced. Here is a modification to the Google Analytics code that you need to make (on the example of the latest, asynchronous code):


<script type="text/javascript">


  var _gaq = _gaq || [];


  _gaq.push(['_setAccount', 'UA-XXXXXXX-1']);


  _gaq.push(['_trackPageview']);


  setTimeout("_gaq.push(['_trackEvent', '15_seconds', 'read'])",15000);


  (function() {


    var ga = document.createElement('script'); ga.type = 'text/javascript'; ga.async = true;


    ga.src = ('https:' == document.location.protocol ? 'https://ssl' : 'http://www') + '.google-analytics.com/ga.js';


    var s = document.getElementsByTagName('script')[0]; s.parentNode.insertBefore(ga, s);


  })();


</script>


The setTimeout function is the one that does the trick here, and you can set it up to whatever delay you wish (in this case, it is 15 seconds).


Moreover, since the event is created once 15 seconds lapse, you can define this event as a goal in Google Analytics, and even import this goal as a conversion to AdWords, provided the conditions are met.


We hope this small fix will allow you to track and understand the users’ behavior and quality of the traffic coming to your website more accurately, and make more informed decisions. One thing website owners should be vary of, though, that not only the function may slow down the users' experience, even insignificantly, but will also increase the volume of hits your site sends to Google Analytics, which might bring your usage over the limit (currently set at 10 mln hits per month). As such, this fix should only be applied when necessary and justified by the concept of the website and the landing pages.


Posted by Alexey Petrov, Google Analytics Insights Team


Tuesday, July 24, 2012

Scheduled Release track features update 7/24/12


- Documents: Users will have the ability to edit documents and leave comments offline. You must be running the latest version of Chrome or ChromeOS and install the Google Drive Chrome app to edit offline.

- Drive: Google Drive automatically deletes versions of files when they're older than 30 days or there are more than 100 previous versions of the same file. A new feature allows Drive users to specify that certain revisions should be kept forever.


The following features are intended for release to these domains on July 31st:

- Documents: Users will have the ability to create documents offline. You must be running the latest version of Chrome or ChromeOS and install the Google Drive Chrome app to use this feature.


Release track: 

Scheduled*


Editions included: 

Google Apps, Google Apps for Business, Government and Education


For more information:

Documents:

http://googledocs.blogspot.com/2012/06/announcing-your-two-most-requested.html

http://googledocs.blogspot.com/2012/07/offline-updates-and-quick-look-back-at.html

http://support.google.com/docs/bin/answer.py?hl=en&hlrm=en&answer=1628469


Drive:

https://support.google.com/drive/bin/answer.py?hl=en&answer=2375120&p=dialog_autodelete


*Scheduled Release track: Domains with ‘Scheduled Release’ option enabled in the administrator control panel. Learn more.


whatsnew.googleapps.com


Get these product update alerts by email


Subscribe to the RSS feed of these updates

What's new in DoubleClick for Publishers

Our engineers have been hard at work during the last few weeks to provide you with some new, exciting features in DFP. For a complete list, please visit the DFP or DFP Small Business Help Centers.


Available in DFP:

Teams: Imagine that your organization operates an East and West coast sales team, and you'd like to restrict access to your East coast orders and advertisers so only users on your East coast team can view and edit the campaigns. With the new Teams functionality in DFP, you can now group your network's users into teams, defined by you, enabling you to restrict access to any combination of companies, orders and inventory. Learn more.

Auto-Macro Insertion for Creative Templates: The key to successfully serving third-party creatives and minimizing discrepancies is to make sure that you are properly inserting macros into the third-party code. A macro is a short piece of code provided by DFP that will enable your third-party tags to properly track clicks or track impressions.  In addition to automatically inserting macros for reconginzed third-party creatives, DFP will now also recognize and insert macros for  third-party code in custom creatives and custom creative templates. This provides you with the same macro-insertion support and efficiencies you are used to when trafficking regular 3rd party creatives.

Ad Exclusions: 
There are situations when you will want to avoid an advertiser running on a competitor's website. For example, if you've got a news story about a plane crash, you probably don't want to run airline ads next to it. Ad Exclusions provide controls to prevent labelled line items to deliver on specific inventory. These labels can additionally be added per default on company level to ensure a smoother workflow for your trafficking operations.


Creative Upload for Standalone Creative Library: The recently launched Standalone Creative Library now supports the ability to upload creatives and creatives sets directly, which can be stored for later use.

Local Time Zone Trafficking: In addition to being able to change the role and language you use DFP in, you can now change a DFP user's time zone to match the user's location. When you do, the displayed times throughout the trafficking sections of DFP will be adjusted to match the time in the location you've set for the user.

Available in DFP and DFP Small Business:

Additional Reporting Scheduling options: We’ve added further  granularity to reporting scheduling options to give you more insights into the health of your inventory. You can now schedule your reports with additional breakdowns such as year-to-date, quarter-to-date, month-to-date, and lifetime.

SDK Mediation for Mobile: SDK Mediation is a form of ad network optimization for mobile in DFP which allows you to set up a waterfall (or daisy chain) of networks, where one network after another is called until an impression is filled. Use this new feature to send impressions from mobile applications to ad networks via the ad networks' own SDKs.This is useful when:


  • An ad network only accepts requests from its own SDK

  • Certain custom formats are only available in the ad network's SDK

  • Information provided by the SDK, such as location information or a unique user ID, enables higher CPMs


Available in DFP Mobile:

Frequency Capping: Frequency capping is now available for mobile in two ways:


  • Line item frequency capping: For mobile web, this uses cookies in a similar fashion as desktop (the DoubleClick cookie where possible; otherwise the DFP first party cookie). For mobile applications, this uses a double-anonymised identifier generated by the Google AdMob SDK.

  • Ad unit frequency capping: Ad unit frequency capping now works for mobile in cases where there is an identifier available.


Available in DFP Video:


  • Fallback Image for VAST Non-linear ads: It’s now possible to display a fallback image when VAST non-linear ads fail to render.

  • VPAID Creative Validation: DFP will validate hosted linear and non-linear VPAID creatives and notify the user if it's invalid.


Posted by Alex Strittmatter, DFP Product Specialist

Understanding And Using Page Value

When Google launched Google Analytics many moons ago (2005 to be exact) there was a metric named $Index. It wasn’t your standard analytics metric, like pageviews or visits. It was a calculated metric to help businesses understand value of content. Unfortunately $Index was removed from Google Analytics version 5 due to some technical limitations.


But now it’s back as a new metric named Page Value!


How Page Value Is Calculated


Page Value is calculated using the value of your transactions and your goals. So even if you don’t have an ecommerce website you can still use Page Value. Just make sure you have defined some goals and assigned them a value. (If you need more information about defining and tracking conversions check out our Getting Started Fast with Google Analytics webinar).


Here’s the exact formula of how Page Value is calculated:


Page Value = (Transaction Revenue + Total Goal Value) / Unique Pageviews for the page


Page Value can also be calculated for a group of pages, like a directory. In that case the definition changes slightly.


Page Value = (Transaction Revenue + Total Goal Value) / Total unique Pageviews for the group of pages


Remember, a unique pageview is just a count of visits that include the page. If a page is viewed five times in a single visit, Google Analytics will count five pageviews but one unique pageview.


Now there are a couple of things to be aware of. The calculation does not include all transaction and goal revenue for the entire visit. It’s only the goal conversions and transactions that happen after the page is viewed, not before the page is viewed.


Enough of the math and description, let’s look at an example. 


Here are two hypothetical visits:


Visit #1 activity:


Visit #2 activity:


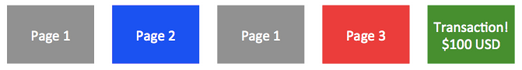
Here’s how Google Analytics would calculate the value of Page 1, Page 2 and Page 3.


Page 1: ($100 revenue + $40 revenue + $0 goal value) / 2 unique pageviews = $70


Page 2: ($100 revenue + $40 revenue + $0 goal value) / 2 unique pageviews = $70


Page 3: ($100 transaction revenue + $0 goal value) / 1 unique pageviews = $100


How to Use Page Value


Page value is a measure of influence. It’s a single number that can help you better understand which pages on your site drive conversions and revenue. Pages with a high Page Value are more influential than pages with a low Page Value.


Get started by reviewing the Page Value column in the Content > All Pages report.


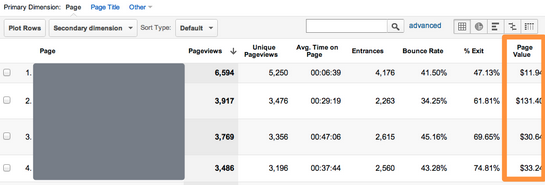
Your site probably has a lot of pages. Here’s a tip, use the Advanced Table Filter in the content report to remove some of the noise from this data. You can set up a filter to exclude pages with a Page Value of 0 or less than 30 pageviews. 


If you’re an ecommerce company you’ll immediately notice that the most valuable pages on your site are your checkout pages. This makes sense because everyone needs to view the checkout pages before converting.


Start by looking for pages that get a lot of traffic (pageviews) but have a low Page Value. Why don’t these pages help conversion? Should they? Use some of the other metrics, like Avg. Time on Page, Bounce Rate  or Exit Rate to get a better picture of the user experience on this page. 


If people are using the page, but not ultimately converting you may want to use some of the other content tools, like Flow Visualization, to get a better understanding of their experience after using a piece of content. 


Also look for pages that get a low volume of traffic but have a high Page Value. These pages are influential but don’t get a lot of attention. You might consider promoting them more via an external marketing campaign (email, PPC, social media) or an internal campaign (homepage banner, etc.).


If you work in SEO then you should definitely check out the Page Value for the content you are optimizing.


Page Value is not a silver bullet. It does not magically generate more conversions for your business. But it is an actionable metric that can help you understand the behavior of your visitors.


Posted by Google Analytics Advocate Justin Cutroni


Monday, July 23, 2012

Analyzing your Google App Engine Logs with Google BigQuery

Developers know that logging and logs analysis can often mean the difference between delighting and disappointing users. With the Google App Engine LogService API, it’s easy to add logging to your App Engine App with just a few lines of code. But of course, logging events is only the beginning, and today we’re particularly excited to highlight using Google BigQuery to analyze your App Engine logs.

Google BigQuery is an externalized version of Google’s own logs analysis framework that allows developers to run queries across billions of rows of data in seconds via a RESTful API. BigQuery uses a familiar SQL-like query language and is able to scale to datasets that are terabytes in size and beyond. We see BigQuery as a natural fit for logs analysis, and at I/O this year, our developer relations team led a codelab demonstrating how to import and analyze App Engine logs with BigQuery.

Our customers have also had success with this technique, and App Engine developers at Streak.com posted their own walkthrough and Java framework, called Mache, for automatically exporting App Engine logs into BigQuery. Mache provides a simple interface for scheduling cron jobs that parse and ingest log file data into BigQuery at user-defined intervals.

If you’re interested in trying out Google BigQuery with App Engine, check out the getting started guide and the sample code from our I/O codelab. Happy logging!


- Posted by the Google App Engine Team


Also, if you’re interested in analyzing Datastore data in BigQuery, check out our article that shows how to use App Engine MapReduce to manage the transformation and export of Datastore entities.

AdMob SDK 6.1 Released

Last week, we released AdMob SDK v6.1 for both Android and iOS. This SDK contains a number of important bug fixes and exciting new features including:


Additional DoubleClick support

DoubleClick publishers will be happy to know that AdMob now provides support for app events, giving them the ability to execute custom code in their application when a creative dispatches an app event. Additionally, the new SDK provides support for multiple ad sizes using the same banner.


Easy access to Google Analytics

You’ll notice we’ve included the latest Google Analytics package in the “Add-Ons” directory. The new mobile app analytics provides the same best-in-class Google Analytics reporting, but for mobile apps.


If you have any questions about the AdMob SDK, please let us know on the forum or hang out during our upcoming AdMob/DFP office hours. For more information about this new SDK, take a look at our release notes.