- How frequently the bid is updated. We chart intra-day bid changes, so if a bid was updated 10 times in a day, there will be 10 time markers on the graph.
- How the bid is trending over time. Are the changes gradual, drastic, increasing or decreasing, etc.
- How the bid changes have affected other metrics. The Max CPC bids can be charted at the same time as any other metric, such as Cost.
- How the Performance Bidding Suite is managing your keyword. If the keyword is in a bid strategy, you’ll get greater visibility into DS-managed bid changes.
To chart a bid history:
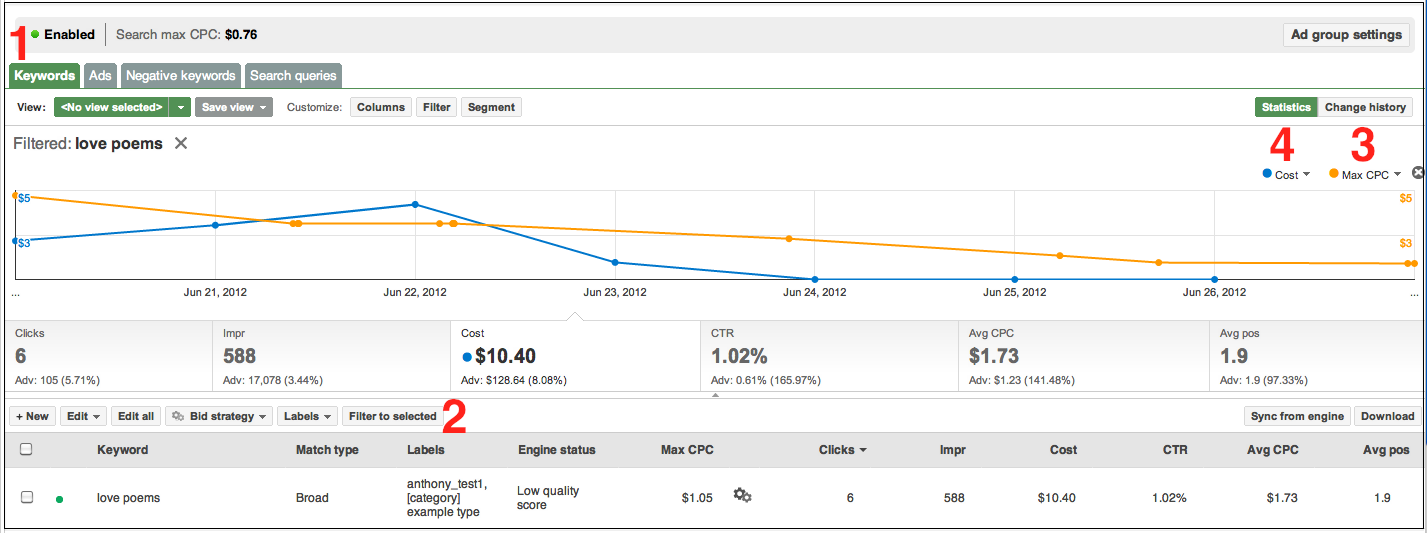
- Go to a Keywords page in the UI.
- Select one keyword in the statistics table and click Filter to selected.
- In the upper righthand corner of the performance summary graph, select Max CPC as a metric.
- You may also want to select a second metric like Cost, so you can see how cost correlated with your bids over time.
Learn more about charting a bid history in the Help Center.
Posted by the DoubleClick Search team
No comments:
Post a Comment