Our team has been focused on bringing you more tools for better measurement and actionable insights, right in the interface. Until now, marketers have been using labels in DoubleClick Search (DS) to easily organize and report on keyword performance by placing keywords into custom categories, regardless of which campaigns they live in.
Now in our latest release, we’ve added another layer of reporting flexibility with Budget Pacing Reports. These reports allow you to track performance against a budget in the DS UI. By visualizing week-over-week, day-over-day, or month-over-month trends, Budget Pacing Reports allow you to quickly identify campaigns that are under-spending or underperforming.
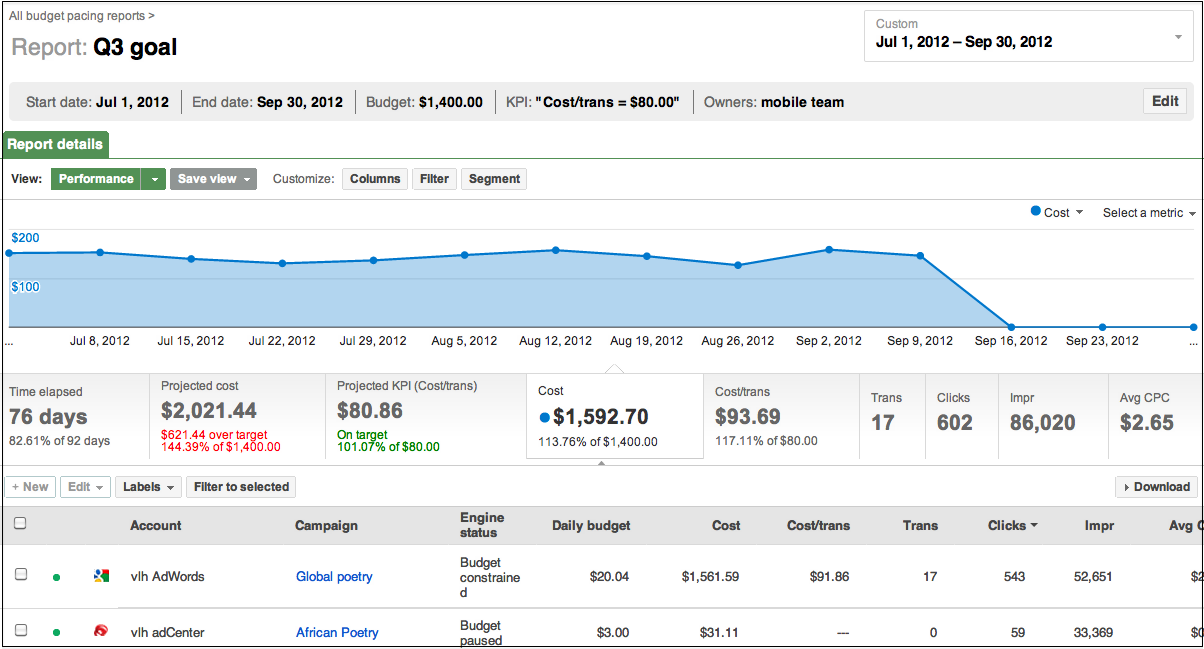
Tracking spend against a budget goal is a common need for many users. These reports save time for agencies that need to look at such data on a regular basis. Budget Pacing Reports provide:
- A rich language for entering KPI expectations with your budget target. Define your KPI goals, set expectations and constraints, and see if your campaigns are on track to deliver on them. For example: I want CPA of $40.00 and I tolerate +-10% error.
- Data visualization for quick projections and insights. Given your entered specifications and expectations, easily visualize different date ranges to see trends and projections of intended outcomes to help you make the best decisions.
- A holistic view across campaigns. See how each campaign is contributing toward budget and KPI.
To learn more about Budget Pacing Reports, see our Help Center, or reach out to your Technical Account Manager for tips and best practices. You can also watch our training video below:
Posted by the DoubleClick Search team