Showing posts with label Map of the Week. Show all posts

Tuesday, September 18, 2012

Map of the Week: MOCA: Ends of the Earth

Map of the Week: MOCA: Ends of the Earth: Land Art to 1974

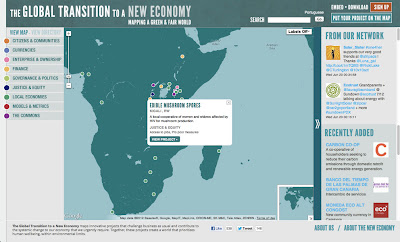
Why we like it: The Museum of Contemporary Art, Los Angeles (MOCA) "Ends of the Earth” site a great example of using Google Maps as a conduit for connecting art with the real world. This map gives the viewer real world context for the artwork. We also like seeing a user interface that uses a full screen map and is designed to work as one with the map.


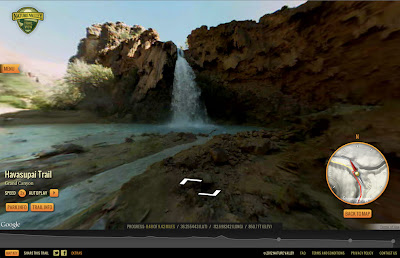
MOCA: Ends of the Earth was created as an at-home interactive experience for museum guests and the newest collection at the MOCA. The goal is to give users meaningful context using Google Map’s repository of global Satellite and Street View imagery. As described by MOCA, “Developed by MOCA for End of the Earth: Land Art to 1974, this interactive feature maps key artworks included in the exhibition, pinpointing their original locations to demonstrate the global nature of land art and its relations to real places and times.”


Aside from being a great way to learn about a piece of art that interests you, the site’s user interface creates a very pleasant experience for the user. You can also download a KML file and view the collection in Google Earth.


Perhaps one of the most nostalgic pieces of artwork in the collection is Charles and Ray Eames’ film Powers of Ten. Using this site you can visit the location where some of the film takes places and in an interactive ode to the film, you can recreate Powers of Ten anywhere you want by zooming in and out of Google Maps directly on the site.


Thursday, August 23, 2012

Map of the Week: Volkswagen Street View Quest

Map of the Week: Volkswagen Street View Quest

Why we like it: We really like this creative approach to interacting with Street View imagery. This Google Maps API implementation shows us that are still many different ways to take advantage of the imagery offered in the API.


When I was kid, my friends and I would play a game called “Punch Beetle” (also known as punch bug, punch dub, piggy punch, slug bug, or beetle bug depending on where you’re from). In brief: the object of the game is to be the first one to spot a Volkwagen Beetle and call out "Punch buggy!" or "Slug bug!" while punching your opponent in the arm.


In many ways, this game is a real world viral meme that became popular without the Internet. Using Google Street View imagery via the Google Maps API, Volkswagen found a way to translate this old tradition into an online game that you can play anywhere in the world without actually having to be in the car or punching anyone. Head over to the Street Quest site for a cool YouTube trailer and to start playing (note: you'll need a facebook login to participate in the challenge).


In VW Street View Quest, players search Google Street View imagery to find and tag any VW vehicles (not just bugs) that have been picked up by our cameras. The person who tags the most vehicles wins the challenge. There are also bonus challenges where users are asked to find the location of a particular car using only a few degrees of the Street View panorama as a clue.


Currently, prizes are only available to residents of South Africa, but the rest of the world can still explore the site and follow along. The top four users who find the most VW vehicles in Google Street View get to compete against each in real life to find the most VWs in Cape Town, South Africa. Overall, this concept is a fun way to embrace the sub-cultures and memes that have sprung up around the VW brand and share them with the rest of the world.


Tuesday, August 14, 2012

Map of the Week: runtastic PRO

Map of the Week: runtastic PRO

Why we like it: runtastic is using Google Earth to show a user 3D Earth View video playback of every run or GPS activity they track with runtastic PRO for Android. In addition to retracing a route, runtastic displays the time, pace, elevation, places of interest, and more. Users can also choose to review their activities with three zoom levels and three playback speeds.


[Editor’s note: For this week’s “Map of the Week” post, we’ve asked Stephan Brunner, Head of Android Development at runtastic, to write a guest blog post about what his team used to create runtastic Earth View - Paul Saxman]


Whether you’re running your first half marathon, biking across the Golden Gate Bridge, or hiking in Nepal, runtastic’s Google Earth playback feature allows you to hold on to the memory and imagery of your activity.


How do we make this happen? The runtastic app captures GPS coordinate data and transforms it into a KML file, and then starts the Google Earth app with an Android Intent, passing a reference to the file in the Intent URI. The Google Earth app loads the track and takes it from there.


The <gx:Track> and <gx:Tour> extension to KML are the perfect tools for making the new 3D experience happen. The <gx:Track> element contains the entire GPS data recorded by the runtastic app, and <gx:Tour> defines the camera animations, overhead view and angle. The Google Earth app matches the elements of both lists using the time-span information from each list element. The result is a smooth animation of the track being painted based on the data from a run, which makes the user feel like they’re flying along it!


runtastic PRO Google Earth Tour on Galaxy Nexusruntastic PRO Google Earth Tour on Nexus 7


With this great new 3D Earth View, we think that there is no reason to stay on the couch. Get out there and record some amazing activities!


Posted by Paul Saxman, Google Maps API Developer Relations Team

Thursday, July 12, 2012

Map of the Week: Bostonography Neighborhoods

Map of the Week: Bostonography Neighborhoods

Why we like it: This is a unique solution to an old problem. We really like the use of drawing tools to collect information and Styled Maps to help the data stand out better.


In almost every city, there is some disagreement as to where one neighborhood ends and another begins. Furthermore, as is often the case, reputable sources have differing neighborhood lines. In reality there are no physical lines on the ground clearly defining neighborhoods, however these hypothetical boundaries do have a real impact on local economies, politics, and identity. Bostonography has set out to solve this problem by creating a tool to collect as many neighborhood definitions as possible.


From the Bostonography website, “We want to map the collective definitions of Boston's neighborhoods by its residents and those who know the city well. This map is a tool for drawing top-level neighborhood boundaries … as you see them, and submitting them to a database that will be used to map the areas of agreement and disagreement among participants.”


Bostonography has begun to parse the data and has calculated which neighborhoods have the most agreement and which have the most disagreement. The results of the first few data sets are stunning. To further illustrate how complex neighborhood definitions can be, this separate example by The Boston Globe shows just how “tangled” neighborhood boundaries are, even amongst city agencies!


If you have knowledge of Boston yourself, Bostonography encourages you to contribute to the map. “Submit a map of as many or as few neighborhoods as you wish, but we of course encourage you to draw all of them. Detail as intricate as you have patience for is appreciated, too, for the sake of the eventual maps of the results.”


So whether you’re from Southie or from Allston, we all can agree that this map is wicked awesome.


Wednesday, June 20, 2012

Map of the Week: The Global Transition to a New Economy

Map of the Week: The Global Transition to a New Economy

Why we like it: This map is a great way to discover NGO projects from all over the world. The info-graphic style of the site is a well designed way to catalog a large amount of information, that’s easy to access and understand. Additionally, by using Styled Maps to simplify the color scheme of the map, the color coded markers really pop out.


In the run-up to this year’s United Nations’ Conference on Sustainable Development 2012 (Rio+20), the New Economics Institute launched the Global Transition to a New Economy. As described by the organization, “The Global Transition to a New Economy maps innovative projects that challenge business as usual ... Together, these projects create a world that prioritizes human well being, within environmental limits.”


Promoting activism on a global scale is a very complex task. This map aims to make things easier by cataloging the efforts of many different NGOs on and around the map.


The map employs several design elements to create a very focused message. For example, the color of the map fits in well with the branding of the site and there’s even the ability to turn political labels on or off, which is a creative way of using styled maps to show that the problems we face in future are not exclusive to any boundary.


It’s great to see another example of the Google Maps API being used to promote good causes in the world. We hope visitors will use this map to discover great organizations around the world and help solve the environmental and economic problems we face.


Tuesday, June 12, 2012

Map of the Week: Nature Valley Trail View

Map of the Week: Nature Valley Trail View

Why we like it: This map has a lot of great qualities. In particular: It’s a great example of custom Street View panoramas in the Google Maps API and it’s a great example of using the Google Maps API as the centerpiece of a interactive marketing campaign with a positive goal.


Launched in March 2012, Nature Valley Trail View uses custom Street View panoramas to take viewers through select national parks in the United States. What really impressed us is the number of custom Street View panoramas. Taking DIY to a whole new level, the developers of this site even created their own cameras to build upon the imagery that’s already available in the Google Maps API.


According to Nature Valley, the site is about supporting the causes that are important to its customers. This site is part of larger partnership between Nature Valley and the National Parks Conservation Association, a nonprofit group that supports national parks in the U.S.


In using the Google Maps API, Nature Valley Trail View has proven that it’s possible to create marketing collateral that provides real value to a customer. Below is a short video from Nature Valley explaining the origins of the projects.


Above all, this Google Maps API implementation reminds us that many images can be shared as a Google Street View like experience. So if you would like to have your own Street View panoramas (to share with the world or just a small group of people) it’s possible to pick up a camera and create your own great imagery.