Showing posts with label Styled Maps. Show all posts

Thursday, July 12, 2012

Map of the Week: Bostonography Neighborhoods

Map of the Week: Bostonography Neighborhoods

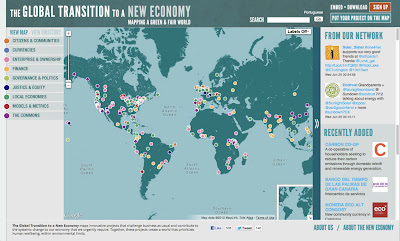
Why we like it: This is a unique solution to an old problem. We really like the use of drawing tools to collect information and Styled Maps to help the data stand out better.


In almost every city, there is some disagreement as to where one neighborhood ends and another begins. Furthermore, as is often the case, reputable sources have differing neighborhood lines. In reality there are no physical lines on the ground clearly defining neighborhoods, however these hypothetical boundaries do have a real impact on local economies, politics, and identity. Bostonography has set out to solve this problem by creating a tool to collect as many neighborhood definitions as possible.


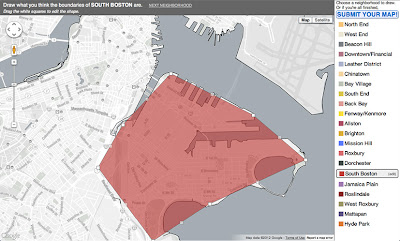
From the Bostonography website, “We want to map the collective definitions of Boston's neighborhoods by its residents and those who know the city well. This map is a tool for drawing top-level neighborhood boundaries … as you see them, and submitting them to a database that will be used to map the areas of agreement and disagreement among participants.”


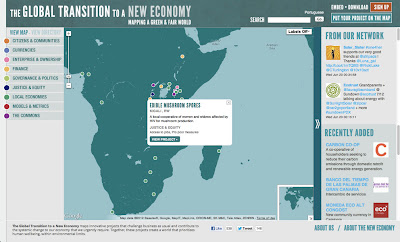
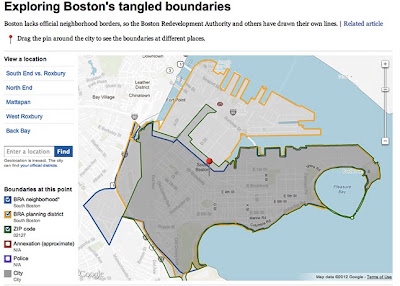
Bostonography has begun to parse the data and has calculated which neighborhoods have the most agreement and which have the most disagreement. The results of the first few data sets are stunning. To further illustrate how complex neighborhood definitions can be, this separate example by The Boston Globe shows just how “tangled” neighborhood boundaries are, even amongst city agencies!


If you have knowledge of Boston yourself, Bostonography encourages you to contribute to the map. “Submit a map of as many or as few neighborhoods as you wish, but we of course encourage you to draw all of them. Detail as intricate as you have patience for is appreciated, too, for the sake of the eventual maps of the results.”


So whether you’re from Southie or from Allston, we all can agree that this map is wicked awesome.


Wednesday, June 20, 2012

Map of the Week: The Global Transition to a New Economy

Map of the Week: The Global Transition to a New Economy

Why we like it: This map is a great way to discover NGO projects from all over the world. The info-graphic style of the site is a well designed way to catalog a large amount of information, that’s easy to access and understand. Additionally, by using Styled Maps to simplify the color scheme of the map, the color coded markers really pop out.


In the run-up to this year’s United Nations’ Conference on Sustainable Development 2012 (Rio+20), the New Economics Institute launched the Global Transition to a New Economy. As described by the organization, “The Global Transition to a New Economy maps innovative projects that challenge business as usual ... Together, these projects create a world that prioritizes human well being, within environmental limits.”


Promoting activism on a global scale is a very complex task. This map aims to make things easier by cataloging the efforts of many different NGOs on and around the map.


The map employs several design elements to create a very focused message. For example, the color of the map fits in well with the branding of the site and there’s even the ability to turn political labels on or off, which is a creative way of using styled maps to show that the problems we face in future are not exclusive to any boundary.


It’s great to see another example of the Google Maps API being used to promote good causes in the world. We hope visitors will use this map to discover great organizations around the world and help solve the environmental and economic problems we face.