Tuesday, July 24, 2012

What's new in DoubleClick for Publishers

Our engineers have been hard at work during the last few weeks to provide you with some new, exciting features in DFP. For a complete list, please visit the DFP or DFP Small Business Help Centers.


Available in DFP:

Teams: Imagine that your organization operates an East and West coast sales team, and you'd like to restrict access to your East coast orders and advertisers so only users on your East coast team can view and edit the campaigns. With the new Teams functionality in DFP, you can now group your network's users into teams, defined by you, enabling you to restrict access to any combination of companies, orders and inventory. Learn more.

Auto-Macro Insertion for Creative Templates: The key to successfully serving third-party creatives and minimizing discrepancies is to make sure that you are properly inserting macros into the third-party code. A macro is a short piece of code provided by DFP that will enable your third-party tags to properly track clicks or track impressions.  In addition to automatically inserting macros for reconginzed third-party creatives, DFP will now also recognize and insert macros for  third-party code in custom creatives and custom creative templates. This provides you with the same macro-insertion support and efficiencies you are used to when trafficking regular 3rd party creatives.

Ad Exclusions: 
There are situations when you will want to avoid an advertiser running on a competitor's website. For example, if you've got a news story about a plane crash, you probably don't want to run airline ads next to it. Ad Exclusions provide controls to prevent labelled line items to deliver on specific inventory. These labels can additionally be added per default on company level to ensure a smoother workflow for your trafficking operations.


Creative Upload for Standalone Creative Library: The recently launched Standalone Creative Library now supports the ability to upload creatives and creatives sets directly, which can be stored for later use.

Local Time Zone Trafficking: In addition to being able to change the role and language you use DFP in, you can now change a DFP user's time zone to match the user's location. When you do, the displayed times throughout the trafficking sections of DFP will be adjusted to match the time in the location you've set for the user.

Available in DFP and DFP Small Business:

Additional Reporting Scheduling options: We’ve added further  granularity to reporting scheduling options to give you more insights into the health of your inventory. You can now schedule your reports with additional breakdowns such as year-to-date, quarter-to-date, month-to-date, and lifetime.

SDK Mediation for Mobile: SDK Mediation is a form of ad network optimization for mobile in DFP which allows you to set up a waterfall (or daisy chain) of networks, where one network after another is called until an impression is filled. Use this new feature to send impressions from mobile applications to ad networks via the ad networks' own SDKs.This is useful when:


  • An ad network only accepts requests from its own SDK

  • Certain custom formats are only available in the ad network's SDK

  • Information provided by the SDK, such as location information or a unique user ID, enables higher CPMs


Available in DFP Mobile:

Frequency Capping: Frequency capping is now available for mobile in two ways:


  • Line item frequency capping: For mobile web, this uses cookies in a similar fashion as desktop (the DoubleClick cookie where possible; otherwise the DFP first party cookie). For mobile applications, this uses a double-anonymised identifier generated by the Google AdMob SDK.

  • Ad unit frequency capping: Ad unit frequency capping now works for mobile in cases where there is an identifier available.


Available in DFP Video:


  • Fallback Image for VAST Non-linear ads: It’s now possible to display a fallback image when VAST non-linear ads fail to render.

  • VPAID Creative Validation: DFP will validate hosted linear and non-linear VPAID creatives and notify the user if it's invalid.


Posted by Alex Strittmatter, DFP Product Specialist

Understanding And Using Page Value

When Google launched Google Analytics many moons ago (2005 to be exact) there was a metric named $Index. It wasn’t your standard analytics metric, like pageviews or visits. It was a calculated metric to help businesses understand value of content. Unfortunately $Index was removed from Google Analytics version 5 due to some technical limitations.


But now it’s back as a new metric named Page Value!


How Page Value Is Calculated


Page Value is calculated using the value of your transactions and your goals. So even if you don’t have an ecommerce website you can still use Page Value. Just make sure you have defined some goals and assigned them a value. (If you need more information about defining and tracking conversions check out our Getting Started Fast with Google Analytics webinar).


Here’s the exact formula of how Page Value is calculated:


Page Value = (Transaction Revenue + Total Goal Value) / Unique Pageviews for the page


Page Value can also be calculated for a group of pages, like a directory. In that case the definition changes slightly.


Page Value = (Transaction Revenue + Total Goal Value) / Total unique Pageviews for the group of pages


Remember, a unique pageview is just a count of visits that include the page. If a page is viewed five times in a single visit, Google Analytics will count five pageviews but one unique pageview.


Now there are a couple of things to be aware of. The calculation does not include all transaction and goal revenue for the entire visit. It’s only the goal conversions and transactions that happen after the page is viewed, not before the page is viewed.


Enough of the math and description, let’s look at an example. 


Here are two hypothetical visits:


Visit #1 activity:


Visit #2 activity:


Here’s how Google Analytics would calculate the value of Page 1, Page 2 and Page 3.


Page 1: ($100 revenue + $40 revenue + $0 goal value) / 2 unique pageviews = $70


Page 2: ($100 revenue + $40 revenue + $0 goal value) / 2 unique pageviews = $70


Page 3: ($100 transaction revenue + $0 goal value) / 1 unique pageviews = $100


How to Use Page Value


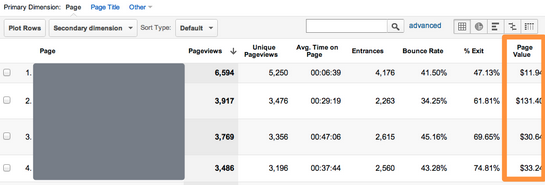
Page value is a measure of influence. It’s a single number that can help you better understand which pages on your site drive conversions and revenue. Pages with a high Page Value are more influential than pages with a low Page Value.


Get started by reviewing the Page Value column in the Content > All Pages report.


Your site probably has a lot of pages. Here’s a tip, use the Advanced Table Filter in the content report to remove some of the noise from this data. You can set up a filter to exclude pages with a Page Value of 0 or less than 30 pageviews. 


If you’re an ecommerce company you’ll immediately notice that the most valuable pages on your site are your checkout pages. This makes sense because everyone needs to view the checkout pages before converting.


Start by looking for pages that get a lot of traffic (pageviews) but have a low Page Value. Why don’t these pages help conversion? Should they? Use some of the other metrics, like Avg. Time on Page, Bounce Rate  or Exit Rate to get a better picture of the user experience on this page. 


If people are using the page, but not ultimately converting you may want to use some of the other content tools, like Flow Visualization, to get a better understanding of their experience after using a piece of content. 


Also look for pages that get a low volume of traffic but have a high Page Value. These pages are influential but don’t get a lot of attention. You might consider promoting them more via an external marketing campaign (email, PPC, social media) or an internal campaign (homepage banner, etc.).


If you work in SEO then you should definitely check out the Page Value for the content you are optimizing.


Page Value is not a silver bullet. It does not magically generate more conversions for your business. But it is an actionable metric that can help you understand the behavior of your visitors.


Posted by Google Analytics Advocate Justin Cutroni


Monday, July 23, 2012

Analyzing your Google App Engine Logs with Google BigQuery

Developers know that logging and logs analysis can often mean the difference between delighting and disappointing users. With the Google App Engine LogService API, it’s easy to add logging to your App Engine App with just a few lines of code. But of course, logging events is only the beginning, and today we’re particularly excited to highlight using Google BigQuery to analyze your App Engine logs.

Google BigQuery is an externalized version of Google’s own logs analysis framework that allows developers to run queries across billions of rows of data in seconds via a RESTful API. BigQuery uses a familiar SQL-like query language and is able to scale to datasets that are terabytes in size and beyond. We see BigQuery as a natural fit for logs analysis, and at I/O this year, our developer relations team led a codelab demonstrating how to import and analyze App Engine logs with BigQuery.

Our customers have also had success with this technique, and App Engine developers at Streak.com posted their own walkthrough and Java framework, called Mache, for automatically exporting App Engine logs into BigQuery. Mache provides a simple interface for scheduling cron jobs that parse and ingest log file data into BigQuery at user-defined intervals.

If you’re interested in trying out Google BigQuery with App Engine, check out the getting started guide and the sample code from our I/O codelab. Happy logging!


- Posted by the Google App Engine Team


Also, if you’re interested in analyzing Datastore data in BigQuery, check out our article that shows how to use App Engine MapReduce to manage the transformation and export of Datastore entities.

AdMob SDK 6.1 Released

Last week, we released AdMob SDK v6.1 for both Android and iOS. This SDK contains a number of important bug fixes and exciting new features including:


Additional DoubleClick support

DoubleClick publishers will be happy to know that AdMob now provides support for app events, giving them the ability to execute custom code in their application when a creative dispatches an app event. Additionally, the new SDK provides support for multiple ad sizes using the same banner.


Easy access to Google Analytics

You’ll notice we’ve included the latest Google Analytics package in the “Add-Ons” directory. The new mobile app analytics provides the same best-in-class Google Analytics reporting, but for mobile apps.


If you have any questions about the AdMob SDK, please let us know on the forum or hang out during our upcoming AdMob/DFP office hours. For more information about this new SDK, take a look at our release notes.


Making Google Analytics Content Experiments Even Better

A few weeks ago, we announced Google Analytics Content Experiments.  Since our announcement, we have been busy making Content Experiments available to Google Analytics users and improving it based on your feedback.  We'd like to tell you about a few changes that we have recently introduced:


Content Experiments available to everyone. Every Google Analytics user can now access Content Experiments. You can find this feature under "Experiments" in the "Content" section of your Standard Reports.


Support for relative URLs. Using relative URLs affords you increased flexibility when defining the location of variations.  This is particularly useful if you have experiments running on multiple domains, subdomains, or pages. You can learn more about using relative URLs in Content Experiments by reading our Help Center article.


Ability to copy experiments. You can now copy experiments by clicking the Copy experiment button on the Edit Settings screen of the experiment you want to copy. If you are running an experiment on a page, this allows you to run additional experiments after the original one finishes without having to add experiment code to your page or otherwise modify it.


Improvements to the experiments report
. We've added regular Analytics-report capabilities to the experiment report, such as: Site Usage, Goal Set, and Ecommerce tabs, and the option to choose which variations you want to plot in the graph.


Click the above image to view the full report


We hope that you find these improvements useful. Our team is working hard to make Content Experiments in Google Analytics even better. Stay tuned for more news!


Posted by Inna Weiner, Software Engineer


I/O 2012: Innovation for Agencies

Google I/O 2012, held last month in San Francisco, was a veritable smorgasbord of innovation – from Chrome’s iOS debut to the unveiling of the Nexus 7, from the launch of Google+ Events to our most ambitious product demo yet, our annual developers’ conference wowed its 5,500 attendees with over 130 technical sessions, 20 code labs, and 155 Sandbox partners. This year, we were also pleased to introduce I/O Live, which brought each day’s events and announcements directly to our agency partners via live streaming, along with exclusive online content such as backstage interviews, product demos, some easter egg surprises, and a live blog on +Creative Sandbox with Christian Haas, Executive Director at Goodby, Silverstein & Partners.


AdWeek’s Tim Peterson recently sat down with Torrence Boone, Managing Director of Agency Business Development – Americas, to understand how a developers’ conference can hold as much significance for agencies as it does for tech enthusiasts. Long a passionate advocate of integrating digital platforms into the agency landscape, Torrence explains:


On agencies, digital, and Google platforms:

We believe that we’re creating this amazing toolkit, or palette, for agencies to do really fantastic things. And we have also seen agencies become a lot more technologically oriented, and they are investing in technology-driven approaches to the way that they’re developing campaigns.


On collaborating with agency partners:


We absolutely spend a lot of time with agencies in soliciting their input and perspective on existing products and on our product road map…They bring fantastic insights at scale because they’re working across various industries and they’re confronting different marketing problems on a day-to-day basis, so we actively solicit their perspective. Their feedback is a powerful source for us in driving the innovation engine that we have going at Google.


On the introduction of I/O Live:


The time felt ripe…to really elevate the new things that we’re introducing because, again, they enable this amazing opportunity to create new experiences and highlight for them that it’s not just about developers; that Google, even though fundamentally we’re a technology company, our desire is to allow agencies in partnership with their clients to create beautiful, seamless, immersive experiences that connect brands to consumers. Particularly given the nature of the announcements this year, it felt particularly important to amp up the visibility of the conference with our agency partners and get them in the mindset of thinking of Google I/O as a way for them to stay on the cutting edge and make sure they’re constantly pushing the envelope with what they’re doing for their clients.

Check out the full interview to learn more about how agencies are leveraging Google platforms, and what we’re doing to help take that innovation to the next level!


Posted by Kelly Duane, Americas Agency Team

Thursday, July 19, 2012

Map data updates for parts of Europe, Africa, and Asia


More maps!


As part of Google's mission to provide the most complete and authoritative maps to everyone, we’re excited to announce upgraded maps for Croatia, the Czech Republic, Greece, Ireland, Italy, Lesotho, Macau, Portugal, San Marino, Singapore, and the Vatican City.


Today’s update follows previous updates in North America, Europe, and Australasia, and is part of an ongoing project we call Ground Truth: in which we source data from regional partners, supplement the data with satellite and Street View imagery, and apply a mix of algorithms and human judgement to produce a consistent and reliable geographic dataset which we can update quickly and corresponds as closely as possible to, well, the truth on the ground. In this case you’ll find our maps now include more precise area boundaries, greater coverage of road networks, and more comprehensive local points of interest. To capture and quickly fix errors reported by our users, we’ve also enabled the Report a Problem tool for these countries.


What does this mean for you, our 800,000 developers? For most of you, these updates will simply roll out over the next 24 hours and your Maps API applications will automatically display the latest imagery; however, for those developers who have cached results from any of our Maps API Web Services, please refresh your cache as soon as possible to ensure your results include the latest information.


As always, if you have any questions or concerns, please post them to our Google Maps API forums and we’ll be happy to respond.